云监控规划,以及思维导图
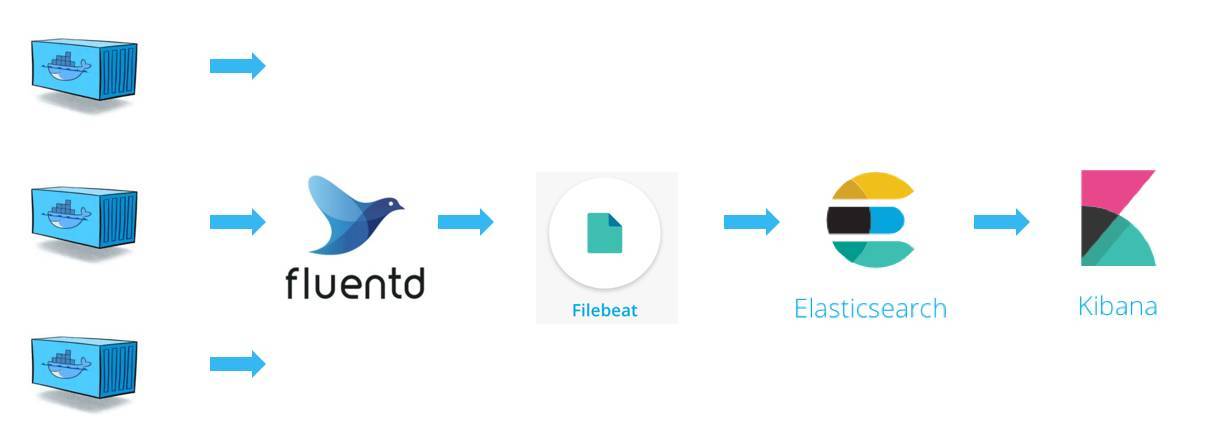
# 收集容器日志
fluentd 部署: https://abc.htmltoo.com/thread-44938.htm
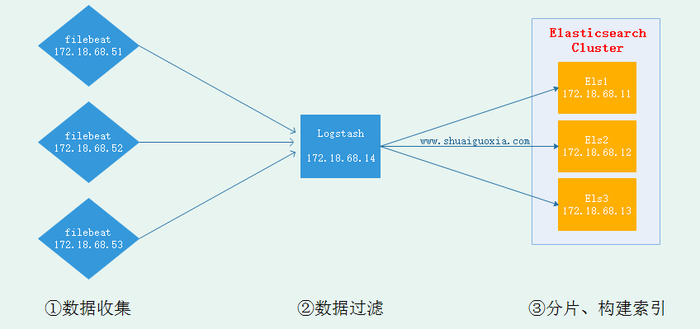
# Filebeat 将 Fluentd 收集到的日志(-logstash数据过滤-)转发给 Elasticsearch
使用一个轻量级日志收集工具Filebeat来收集日志信息,Filebeat统一交给Logstash进行过滤后再Elasticsearch。
1.容器日志. 2.访问日志: nginx, tomcat... 3.系统日志: /var/log/messages, /var/log/secure, /var/log/syslog...
elasticsearch & kibana & filebeat - 7 : https://abc.htmltoo.com/thread-46067.htm
filebeat-logs (服务日志)部署: https://abc.htmltoo.com/thread-44940.htm
logstash 部署: https://abc.htmltoo.com/thread-44933.htm
elasticsearch 部署: https://abc.htmltoo.com/thread-44931.htm
# 节点服务性能监控: mysql-1, redis-1....mysql-2, redis-2....独立服务器系统: cpu-1, disk-1....
prometheus 部署: https://abc.htmltoo.com/thread-44925.htm
#Influxdb 部署: https://abc.htmltoo.com/thread-44919.htm
# 可视化查看
kibana 部署: https://abc.htmltoo.com/thread-44932.htm
Grafana 部署: https://abc.htmltoo.com/thread-44926.htm
# 监控报警 (prometheus基础上)
alertmanager 部署: https://abc.htmltoo.com/thread-45880.htm
alertmanager-dingtalk-hook 部署: https://abc.htmltoo.com/thread-46105.htm
=================
# 节点性能监控: cpu-1 , disk-1, men-1, swap-1.... cpu-2 , disk-2, men-2, swap-2....
Telegraf 部署: https://abc.htmltoo.com/thread-44920.htm
Influxdb 部署: https://abc.htmltoo.com/thread-44919.htm
kapacitor 部署: https://abc.htmltoo.com/thread-44947.htm
chronograf 部署: https://abc.htmltoo.com/thread-44946.htm
=================


